Debug Node Apps in The Browser! Node Tips
When things go horribly wrong in your code, console.log can only get you so far.
I often use the debugger statement in normal JavaScript apps to inspect, stop and step through my code.
Wouldn't it be great if you could debug your Node apps as easily?
Well, obviously, you're about to learn how.
Let's level up and explore a more efficient way to debug your Node.js applications using the --inspect flag.
Let's look at a short code example to see it in action.
Suppose we have a simple Express app with a debugger statement we want to trigger:
// app.js
const express = require("express");
const app = express();
const port = 3000;

app.get("/", (req, res) => {
  debugger; // <-- We want to get this to open in the browser
  res.send("hello world");
});

app.listen(port, () => {
  console.log(`Example app listening on port ${port}`);
});
When running a Node.js application, appending the --inspect flag to your command initiates a debugging session.
It's simple to use:
node --inspect app.js
This will return your debugging session with a URL with the shape of ws://127.0.0.1:9229/some-uid like you can see here:

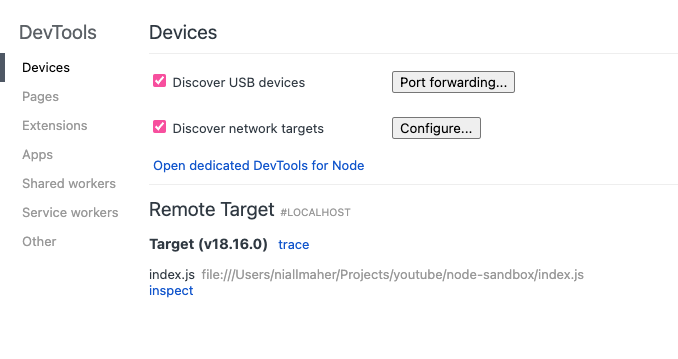
Open chrome://inspect in a Chromium-based browser or edge://inspect in Edge. You should see an option to "inspect" your application as shown below:

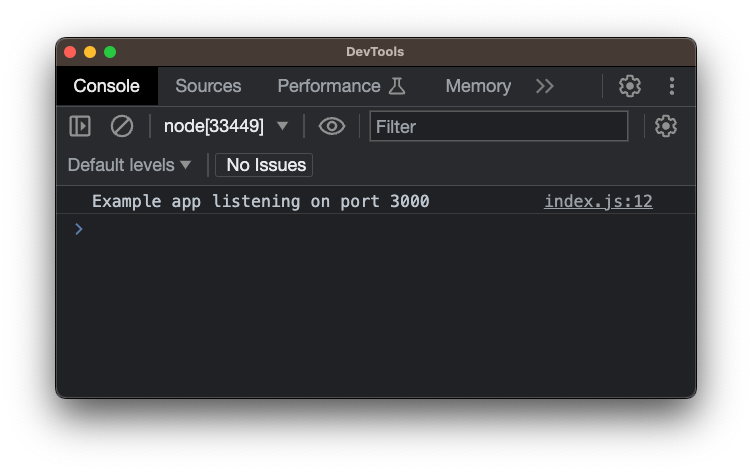
Once you inspect the element, it will open a console like this:

Notice that you can see the normal output that you would see in your terminal here now too (so you can see what you log in your app here too).
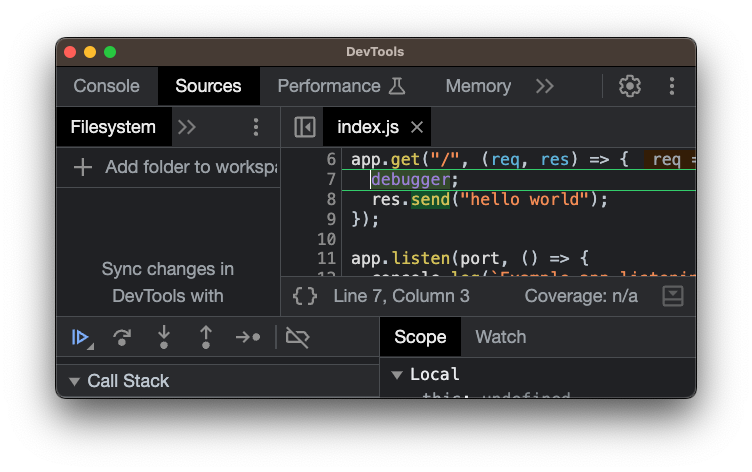
Then if we hit the http://localhost:3000/ route, we should see the debugger being hit:

Now you can use the debugger just like you would in a regular JS application. Step over the code, inspect the variables and make your life much easier! 📈
Follow me on Twitter or connect on LinkedIn.
🚨 Want to make friends and learn from peers? You can join our free web developer community here. 🎉
